Kesko Results Q2 2026: Revenue, Profit and Margins
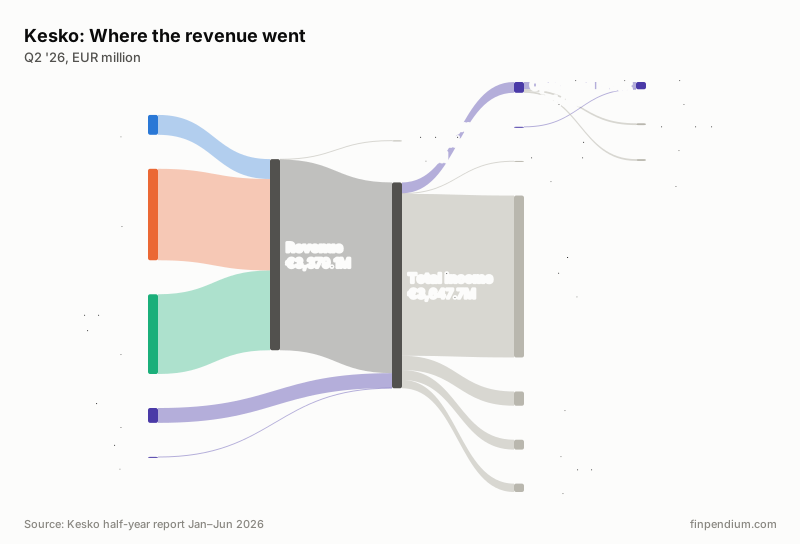
In Q2 2026, Kesko’s revenue was €3,379.1 million, up 6.0% from Q2 2025. Operating profit was €191.0 million, an operating margin of 5.7% (Q2 2025: 5.6%). Net income for the period was €129.2 million and earnings per share €0.32.
Kesko income statement Q2 2026: where the revenue went
Of every €100 of revenue in Q2 2026, €5.7 was left as operating profit and €3.8 as net income.

Key figures for Q2 2026
| Q2 2026 | Q2 2025 | Change | |
|---|---|---|---|
| Revenue, €M | 3,379.1 | 3,188.8 | +6.0% |
| Operating profit, €M | 191.0 | 177.9 | +7.4% |
| Operating margin | 5.7% | 5.6% | +0.1 pp |
| Adjusted operating profit, €M | 194.0 | 176.7 | +9.8% |
| Net income, €M | 129.2 | 117.3 | +10.1% |
| Net margin | 3.8% | 3.7% | +0.1 pp |
| Earnings per share | €0.32 | €0.29 | +10.3% |
Kesko in charts
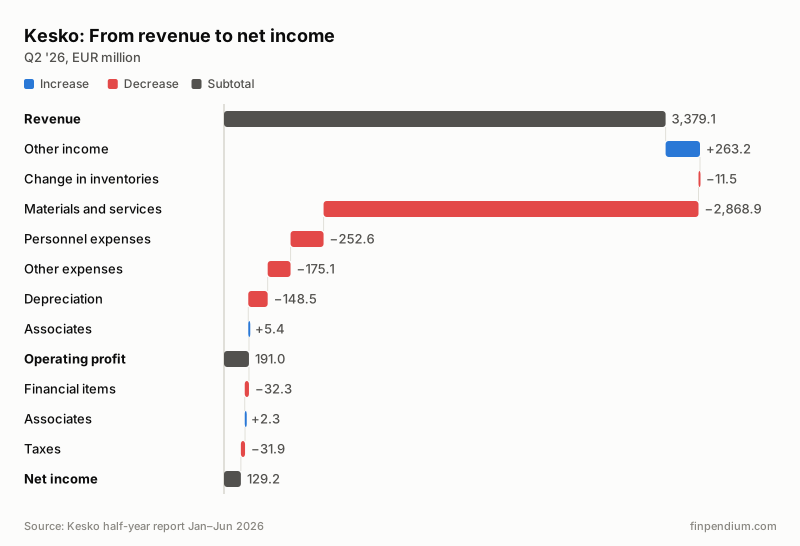
Kesko from revenue to net income, Q2 2026
Net income was €129.2 million on revenue of €3,379.1 million, a net margin of 3.8%.

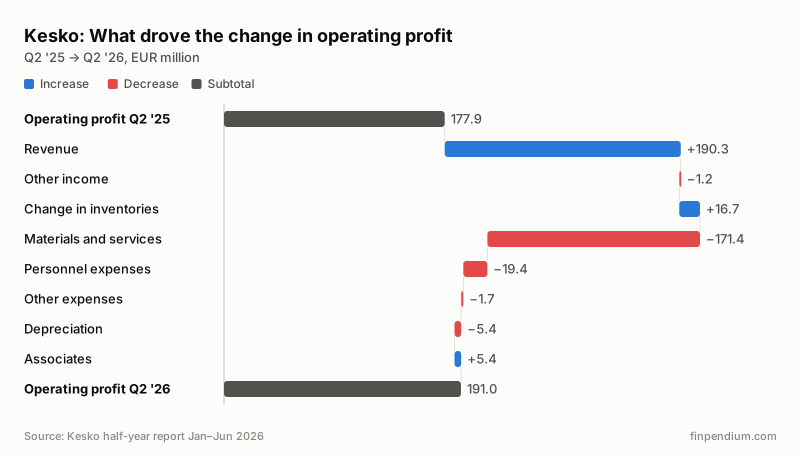
What drove Kesko’s operating profit
Operating profit rose from €177.9 million in Q2 2025 to €191.0 million in Q2 2026. The chart shows which lines of the income statement made up the change.

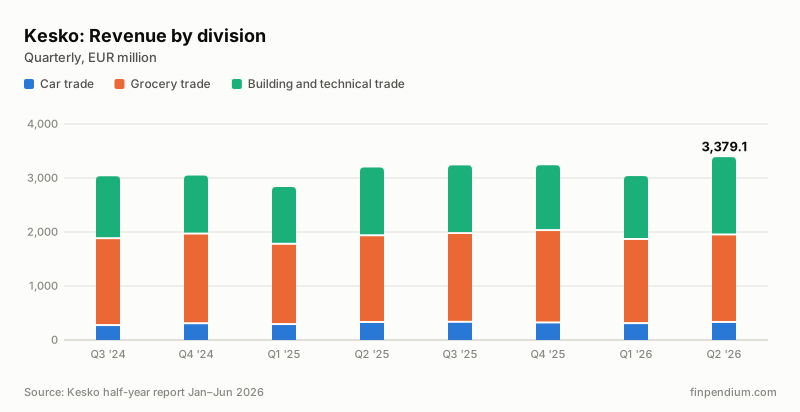
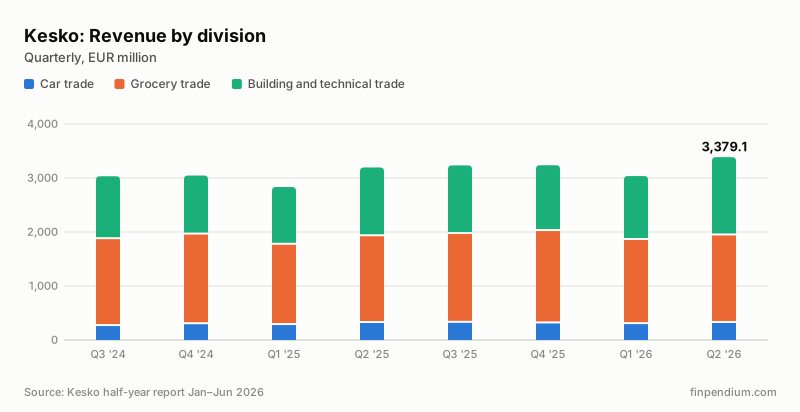
Kesko revenue by division
In Q2 2026, the largest division was Grocery trade with 48.0% of revenue, followed by Building and technical trade (41.8% of revenue).
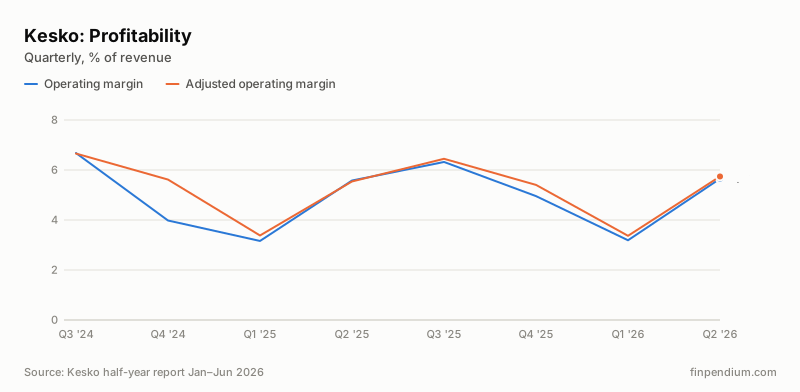
Kesko profitability: profit margins by quarter
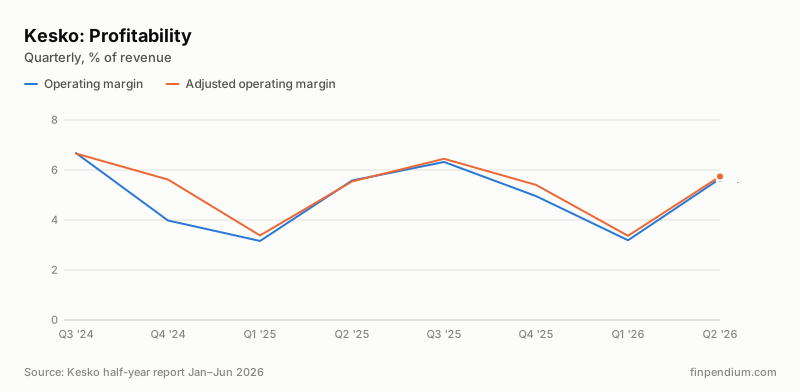
In Q2 2026, Kesko’s operating margin was 5.7% (Q2 2025: 5.6%) and net margin 3.8% (Q2 2025: 3.7%). From Q1 2023 to Q2 2026, the operating margin ranged from 3.2% (Q1 2025) to 7.0% (Q3 2023).
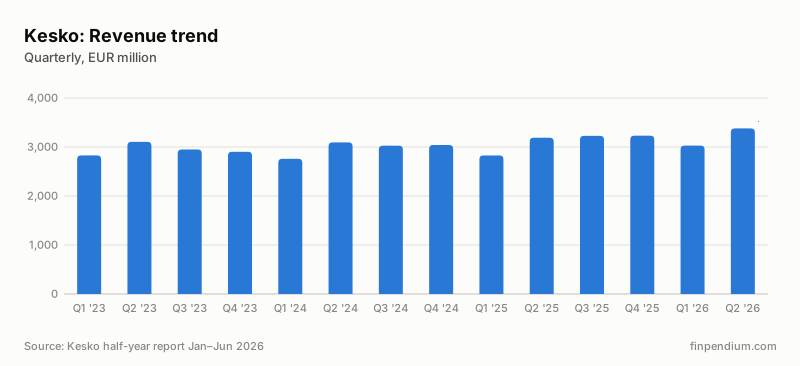
Kesko revenue growth by quarter
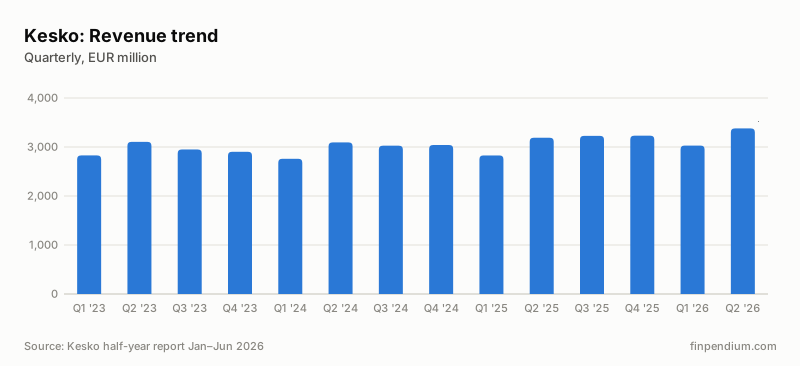
Revenue was €3,379.1 million in Q2 2026, up 6.0% from Q2 2025. The highest quarter from Q1 2023 to Q2 2026 was Q2 2026, with €3,379.1 million.
Kesko operating profit by quarter
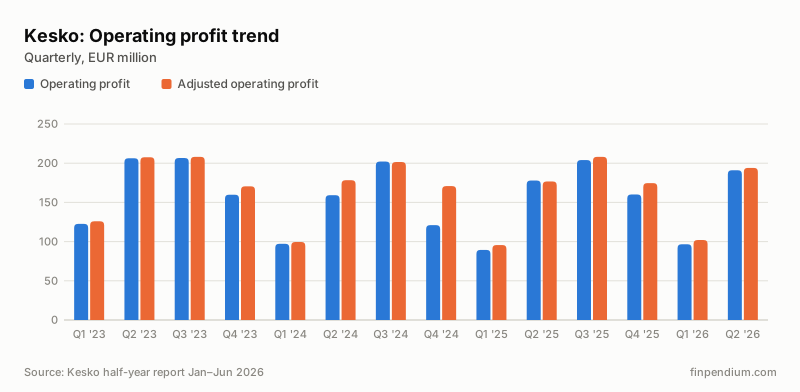
Operating profit was €191.0 million in Q2 2026 (Q2 2025: €177.9 million). Adjusted operating profit was €194.0 million (Q2 2025: €176.7 million).
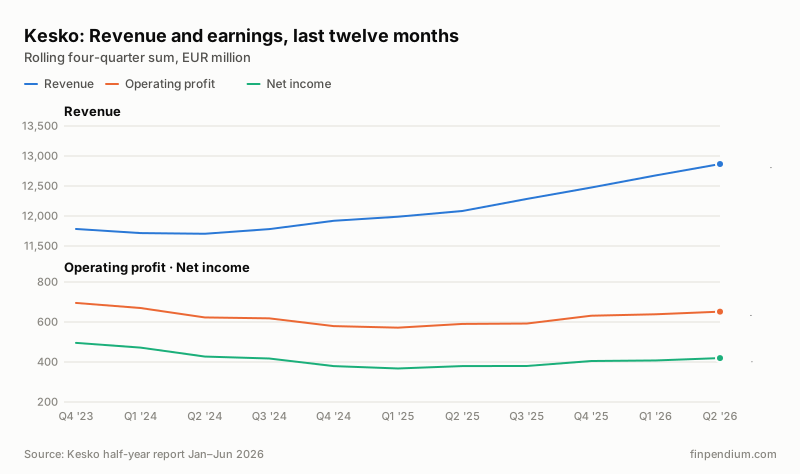
Kesko revenue and earnings, last twelve months
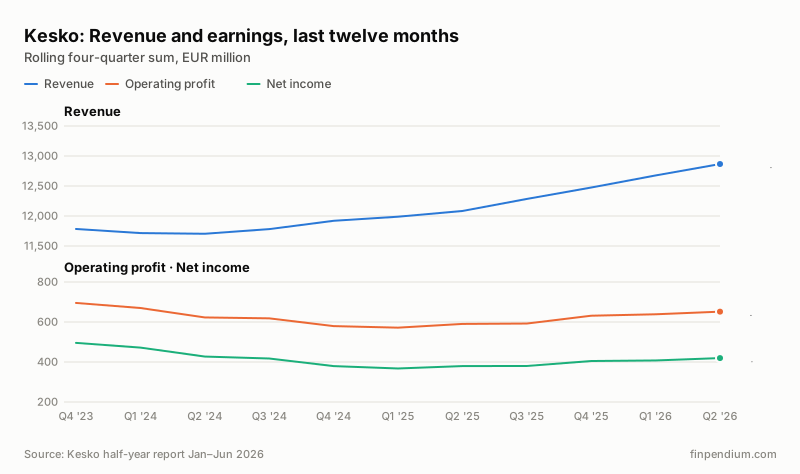
In the twelve months to the end of Q2 2026, revenue was €12,866.3 million (+6.5% on a year earlier) and net income €419.6 million.
Kesko earnings per share (EPS)
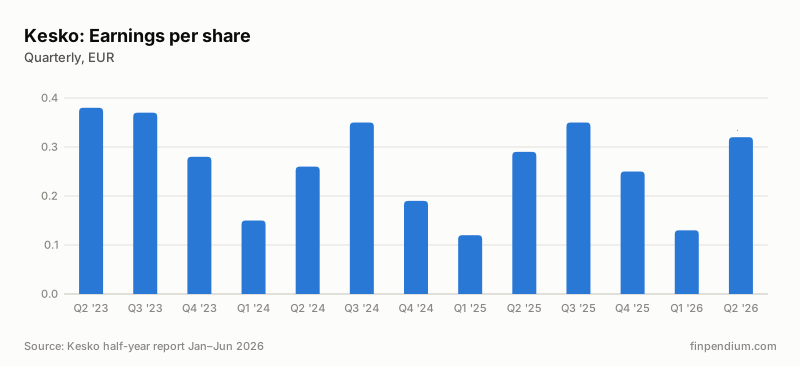
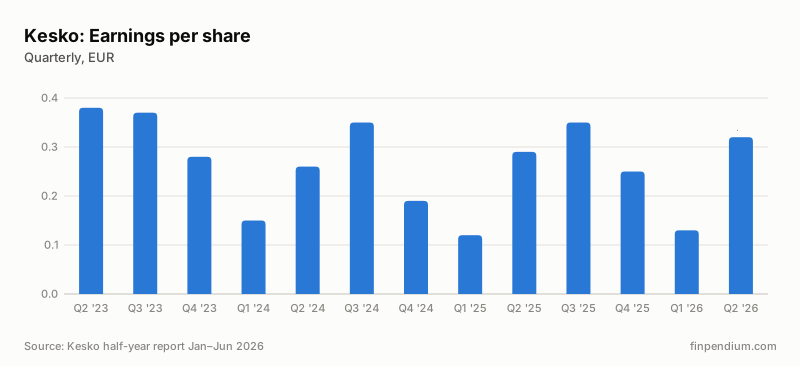
Earnings per share were €0.32 in Q2 2026 (Q2 2025: €0.29).
Quarterly results
| Quarter | Revenue | Change y/y | Operating profit | Operating margin | Net income | EPS |
|---|---|---|---|---|---|---|
| Q2 2026 | 3,379.1 | +6.0% | 191.0 | 5.7% | 129.2 | €0.32 |
| Q1 2026 | 3,029.0 | +7.1% | 96.6 | 3.2% | 51.1 | €0.13 |
| Q4 2025 | 3,230.9 | +6.3% | 160.1 | 5.0% | 99.7 | €0.25 |
| Q3 2025 | 3,227.3 | +6.6% | 204.0 | 6.3% | 139.6 | €0.35 |
| Q2 2025 | 3,188.8 | +3.1% | 177.9 | 5.6% | 117.3 | €0.29 |
| Q1 2025 | 2,827.7 | +2.5% | 89.4 | 3.2% | 48.3 | €0.12 |
| Q4 2024 | 3,040.6 | +4.8% | 121.0 | 4.0% | 74.9 | €0.19 |
| Q3 2024 | 3,026.6 | +2.6% | 202.1 | 6.7% | 139.1 | €0.35 |
Annual results
| Year | Revenue | Operating profit | Operating margin | Net income | EPS |
|---|---|---|---|---|---|
| 2025 | 12,474.7 | 631.3 | 5.1% | 404.8 | €1.02 |
| 2024 | 11,920.1 | 579.5 | 4.9% | 379.6 | €0.95 |
| 2023 | 11,783.8 | 695.4 | 5.9% | 495.6 | €1.25 |
Revenue by division
| Division | Q2 2026 | Q2 2025 | Change |
|---|---|---|---|
| Car trade | 352.5 | 351.9 | +0.2% |
| Grocery trade | 1,620.7 | 1,606.0 | +0.9% |
| Building and technical trade | 1,413.2 | 1,236.8 | +14.3% |
| Eliminations | −7.2 | −5.8 | — |
Dividends
| Financial year | Dividend per share | EPS | Payout ratio | Status | Source |
|---|---|---|---|---|---|
| 2025 | €0.90 | €1.02 | 88.2% | Board proposal | Release |
| 2024 | €0.90 | €0.95 | 94.7% | Decided by the AGM | Release |
“Board proposal” is the dividend the board proposed in the financial statements release. The annual general meeting usually approves it, but check the company’s AGM release for the final decision. Payout ratio is dividend per share divided by basic earnings per share (payout ratio); N/M means not meaningful (loss).
Guidance vs. actual
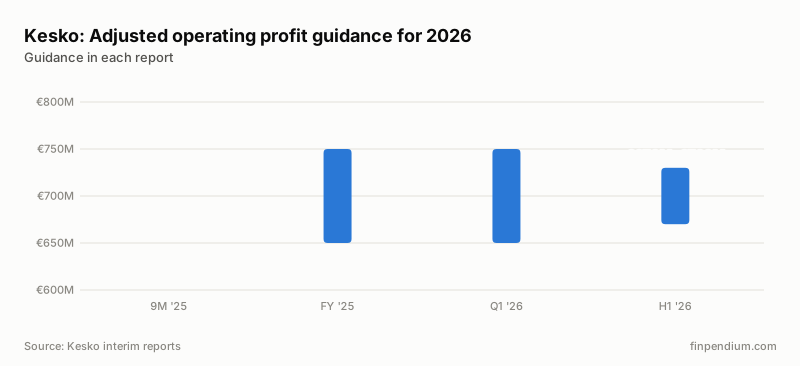
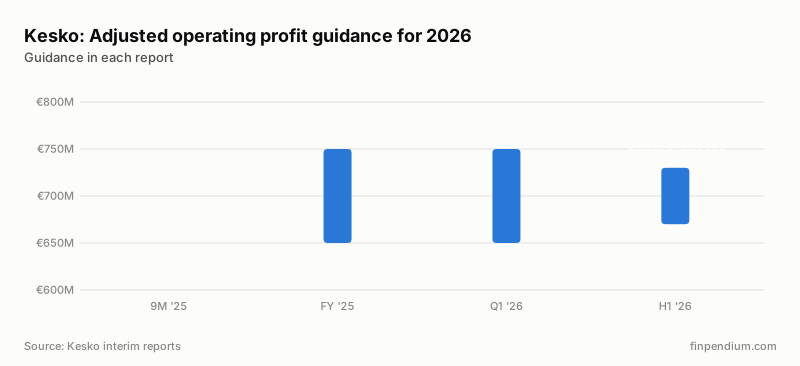
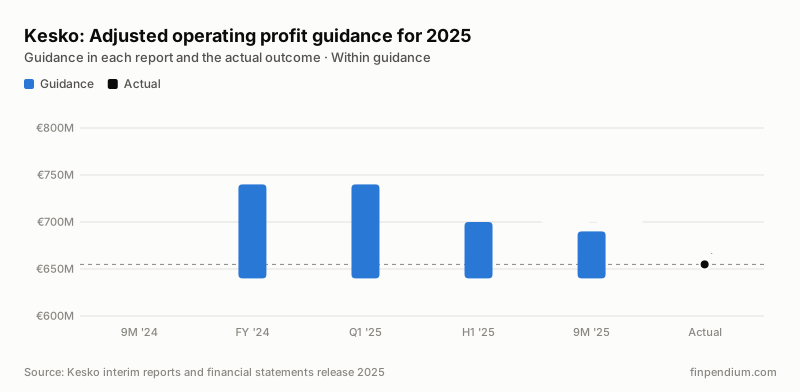
What Kesko told investors to expect in each report, and what it then reported for the year.
| Metric | Latest guidance (report) | Actual | Outcome |
|---|---|---|---|
| Revenue, 2026 | Up (H1 '26) | — | Year in progress |
| Revenue growth, 2026 | Up (Q1 '26) | — | Year in progress |
| Adjusted operating profit, 2026 | €670M–€730M (H1 '26) | — | Year in progress |
| grocery trade: adjusted operating margin, 2026 | At least 6% (FY '25) | — | Year in progress |
| Grocery trade: adjusted operating margin, 2026 | At least 6% (H1 '26) | — | Year in progress |
| Adjusted operating profit, 2025 | €640M–€690M (9M '25) | €654.9M | Within guidance |
| grocery trade division: adjusted operating margin, 2025 | At least 6% (FY '24) | 6.5% | Within guidance |
| grocery trade: adjusted operating margin, 2025 | At least 6% (H1 '25) | 6.5% | Within guidance |
Guidance and actuals are as the company reported them, on the same basis (for example adjusted, or growth at constant currency). “Within guidance” means the actual is inside the latest range or meets the stated minimum or maximum; an “about” figure allows ±5% (±0.5 percentage points for percentages). For a direction such as “flat”, a change of less than 2% (0.5 points for margins) counts as flat. Guidance changed in a separate release between reports is shown from the next report onwards.
Calculate it yourself
- Operating margin calculatorKesko in Q2 2026: 5.7%
- Net margin calculatorKesko in Q2 2026: 3.8%
- Earnings per share calculatorKesko in Q2 2026: €0.32
About Kesko
Kesko is a Finnish retail and wholesale company in grocery trade, building and technical trade, and car trade. It operates mainly in Finland, and its building and technical trade also in the other Nordic countries, the Baltics and Poland.
- Kesko half-year report Jan–Jun 2026, published Jul 22, 2026
- Kesko interim report Jan–Mar 2026, published Apr 29, 2026
- Kesko financial statements release 2025, published Feb 5, 2026
- Kesko interim report Jan–Sep 2025, published Oct 30, 2025
- Kesko half-year report Jan–Jun 2025, published Jul 22, 2025
- Kesko interim report Jan–Mar 2025, published Apr 29, 2025
- Kesko financial statements release 2024, published Feb 5, 2025
- Kesko interim report Jan–Sep 2024, published Oct 30, 2024
- Kesko half-year report Jan–Jun 2024, published Jul 23, 2024
About these figures. All figures come from Kesko’s published interim reports and financial statements releases, linked above, and are checked against them before publication. Errors are still possible, so confirm any figure in the original report before relying on it. Amounts are in millions of the reporting currency. Quarters reported only cumulatively (for example the fourth quarter) are derived by subtraction, and when a company restates earlier figures, older quarters on the previous basis are left out of comparisons. Margins and changes are calculated by Finpendium. This page is for information only and is not investment advice or a recommendation to buy or sell any security. See how the figures are checked and our Disclaimer. Spotted an error? Let us know.